 21.08.2017
24.07.2017
Central & Eastern Europe Developer Landscape 2017 - a report by Stack Overflow
With over a million software developers in the Central Eastern Europe region, about a quarter of them in Poland, Ukraine, Romania and the Czech Republic, are also reaching a creditable level of a 100 thousand

Co-founder of infoShare tech conference and infoShare Academy coding school, member of the Startup Poland Foundation Advisory Board. Previously a senior manager at wp.pl responsible for tech and business development of the biggest Polish e-mail service, adserver technology, search services, and many more.
I am really proud that, based on Stack Overflow data, we can present, for the first time, such a comprehensive study of the software developer market in the CEE region. This shows that countries in the region have a real talent pool in the IT industry that can help their economies to take the advantage of either attracting the biggest internationaltional tech companies or building strong local software challengers. Additionally, these numbers also support rising startup ecosystems.
We are seeing a huge concentration of developers in their capital cities
Another interesting point is that, in the majority of the CEE countries, we are seeing a huge concentration of developers in their capital cities, reaching up to 93% in Latvia. In contrast, Poland’s, capital Warsaw accounts for only for 29%, and in Ukraine, Kiev numbers 43%.
If you look at software developer density, the number of software developers compared to the labor force as a whole, we see that Slovakia and Estonia are true leaders, achieving 3.7 and 3.0, developers per 100 working people respectively, versus a regional average of around 1.3.
Poland is the biggest, most diversified country in the region with 254 thousand developers and seven hubs (Warsaw, Kraków, Wrocław, Katowice, Poznań, Gdańsk and Łodź) each with at least 10 thousand developers. Being based in Poland I find this quite satisfying, but on the other hand I see that there is still at least 50 thousand employees missing on the market. Therefore, the national and local governments should treat this seriously, constantly looking for opportunities by improving educational models and building relocation incentives for experts from other cities and countries. Because, in the face of the Industry 4.0 revolution, and with the almost total digitalization of every aspect of our lives, the potential of developers can act as the most important competitive advantage for their economies.
Key findings
There are roughly 1 million professional-grade software developers across Central & Eastern Europe (CEE)
- One-quarter of these are in Poland
- Across CEE, there are approximately 1.3 developers for every 100 people in the work force
Across CEE, 15% of Web developers are using the Java Web stack
- Most popular Web development language in the region is PHP
- Java market share of Web developers has been steady over last 4 years
Methodology and data sources
The bulk of the data in this report are based on developers’ interactions with content on the English-language version of Stack Overflow
- Stack Overflow is the world’s largest website for software developers, with more than 50 million unique visitors a month. These visitors come to Stack Overflow to ask and answer technical questions with their peers in our community, which make up 95%+ of developers globally. The average visitor comes seven times a month to either consume or contribute to content. The sum of this activity is more than 20 million page views a day during the average work week
- When developers visit Stack Overflow, our database records their IP and MAC addresses, and their web browser is offered a cookie to track their visitation history. By combining this information, we’re able to build a user history that spans multiple devices and working locations, regardless of whether the user is logged in during a particular visit (or, for that matter, has registered for a login at all).
- At the same time, we record which technologies are tagged on the questions each developer is visiting. Our machine learning platform uses the history of tags a developer has interacted with over the last 30 days to assign probabilities that he or she is of a particular ‘kind’ (such as a mobile developer, or systems administrator), and working on a particular stack (such as the .NET stack).
- This allows us to understand exactly how many professional-grade software developers are in a given area, where they are based (for home and work, so sometimes also their commute between the two), the types of developers they are, and the technologies they use.
Stack Overflow is the largest, most trusted online community for developers to learn, share their knowledge, and build their careers. More than 50 million professional and aspiring programmers visit Stack Overflow each month to help solve coding problems, develop new skills, and find job opportunities.
Stack Overflow mined their user activity data in three ways
- Cross-sectional estimates of most developer ‘kind’ and ‘stack’ populations were generated by our machine learning platform, which classifies users using a multi-step process: first determining an overall kind, e.g. ‘Web developer,’ then a subkind, e.g. ‘front-end Web developer,’ and finally a separate classification of the stack(s) the developer is working on. These classification models apply to all visitors to the main Stack Overflow English-language site, regardless of whether they are registered users or logged in. The bulk of the data in this report and the accompanying spreadsheet are outputs from this system.
- Time-series trends in developer kinds and technical stacks were generated by looking at a random sample of 25% of all traffic over the last five years. Rather than counting ‘heads’ the way the classification models do, this technique aggregated all traffic in a region or country and looked at to what extent it was Java-oriented, Python-oriented, etc. These time series measures were then normalized to the canonical percentages of developers of each kind and stack generated by the machine learning platform.
- Time series trends in interest in Firebase and related technologies were generated by looking at the number of questions asked on the English- language Stack Overflow related to each tag, on a by-region, by-quarter basis. (While questions are a different quantity than people, we’ve found in the past that the number of questions asked and the number of people consuming that content tend to be highly correlated.)
Data definitions and notes of caution
- What we mean by ‘developer’: We classify someone as a ‘developer’ for purposes of this analysis if their usage of Stack Overflow is frequent enough to make us think they’re coding for a living or planning to some day. In addition to professional software developers, the data do include but also university (and, in some cases, high school) students and intensive hobbyists. In most cases, however, our classification engine is able to detect the patterns associated with these more casual users and filter them out from our counts.
- What we mean by ‘mobile developer’: We classify someone as a ‘mobile developer’ (sometimes referred to in this report as ‘developer specializing in mobile apps’) if a large proportion of the content they’re viewing on Stack Overflow is tagged with either a mobile operating system, a mobile SDK, or similar technologies that are meant specifically for building mobile device applications. This spans Android, iOS, and Windows Phone. Developers who work on cloud back ends, databases, or other services that may be called by a mobile app are classified separately (primarily as ‘backend Web developers’ or ‘full-stack Web developers,’ depending on the extent to which they use front-end technologies). Developers who work on mobile-enabled websites may be classified as designers, Web developers, or mobile developers, depending on their individual content usage.
- Someone can be two things: Our machine learning platform doesn’t tag a given individual with a single classification. Rather, it assigns each visitor a probability that they’re a Web developer, a mobile developer, etc. In some cases, a developer may be counted as both a full-stack Web developer and a mobile developer.
- Someone can be two places: Many Stack Overflow users login from both their offices and their homes, and we record them as ‘present’ in both places. Some users also VPN in such a way that we think they’re somewhere they’re not. This report presents data at the country and regional level, so these ‘migrations’ don’t have a large effect on the findings.
- English only, for now: The data in this report are based solely on the English- language version of Stack Overflow. Data from the recently-launched Russian- language Stack Overflow may be incorporated into future reports. In general, we find that developers in foreign language markets do view content on the English Stack Overflow, but they’re less likely to contribute new questions, answers, and comments than their peers in Anglophone countries.
Developer populations in CEE
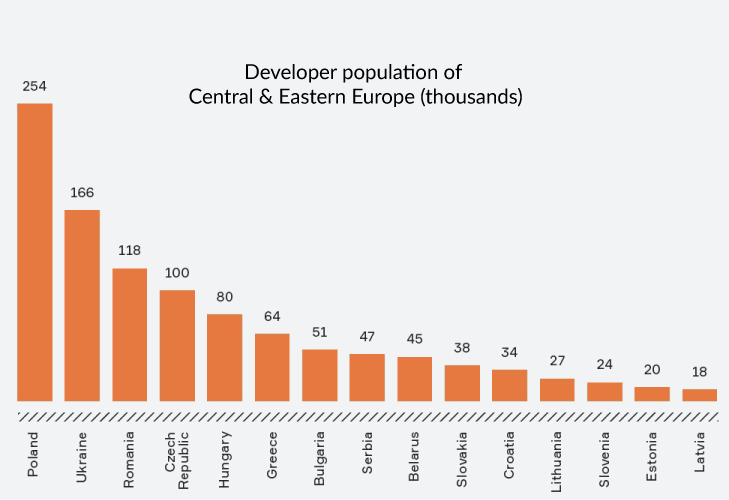
THERE ARE JUST OVER 1 MILLION DEVELOPERS IN CEE
Nearly a quarter (24%) are based in Poland; additional 35% in Ukraine, Romania, and Czech Rep.
- Central & Eastern Europe’s developers account for 6% of the global total.
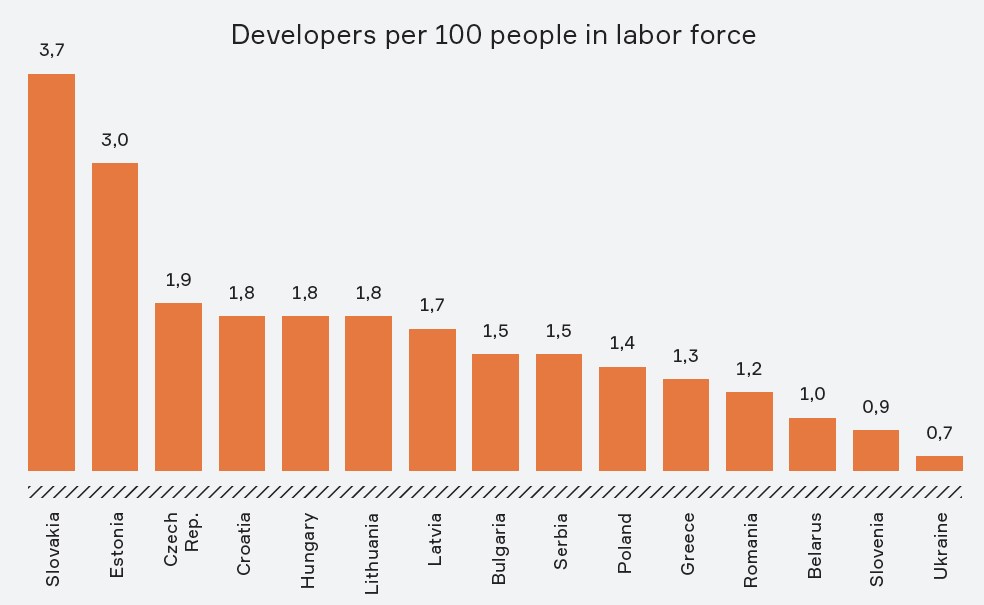
THERE ARE 1.3 DEVELOPERS FOR EVERY 100 PEOPLE IN THE LABOR FORCE ACROSS CEE
Slovakia and Estonia have especially high densities of developers
- Relatively low ratios in Ukraine, Belarus, and Romania may be due to large numbers of developers in those countries preferring to consume content in Russian or another language. Activity from the Russian-language Stack Overflow is not accounted for in our data.
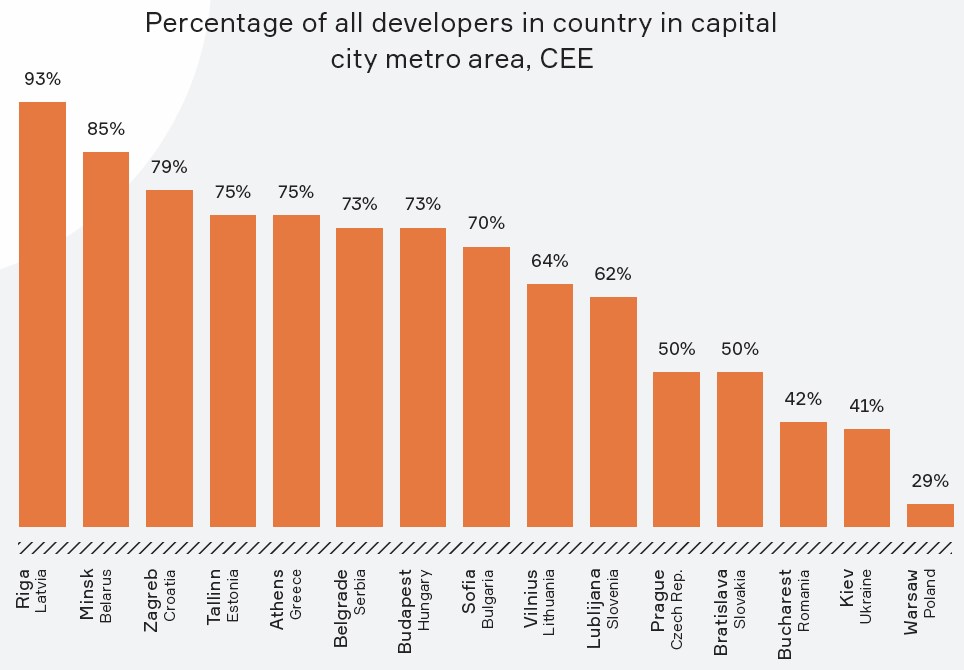
RELATIVELY HIGH PROPORTIONS OF DEVELOPERS IN CEE ARE IN THE CAPITAL CITIES OF THEIR RESPECTIVE COUNTRIES
By comparison, roughly 7% of developers in the USA are in the Washington DC area
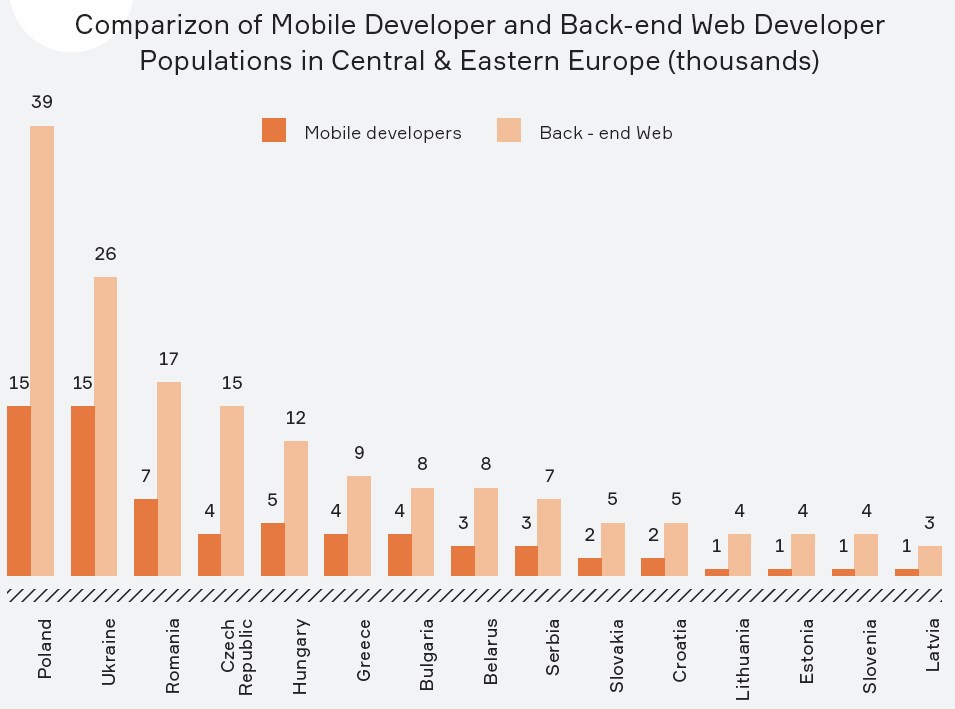
THERE ARE 68K MOBILE DEVELOPERS AND 164K BACKEND WEB DEVELOPERS IN CEE
2.4 back-end specialists per mobile developer in region
- Lowest ratio is Ukraine at 1.8:1
- Highest ratio is Estonia at 4.4:1
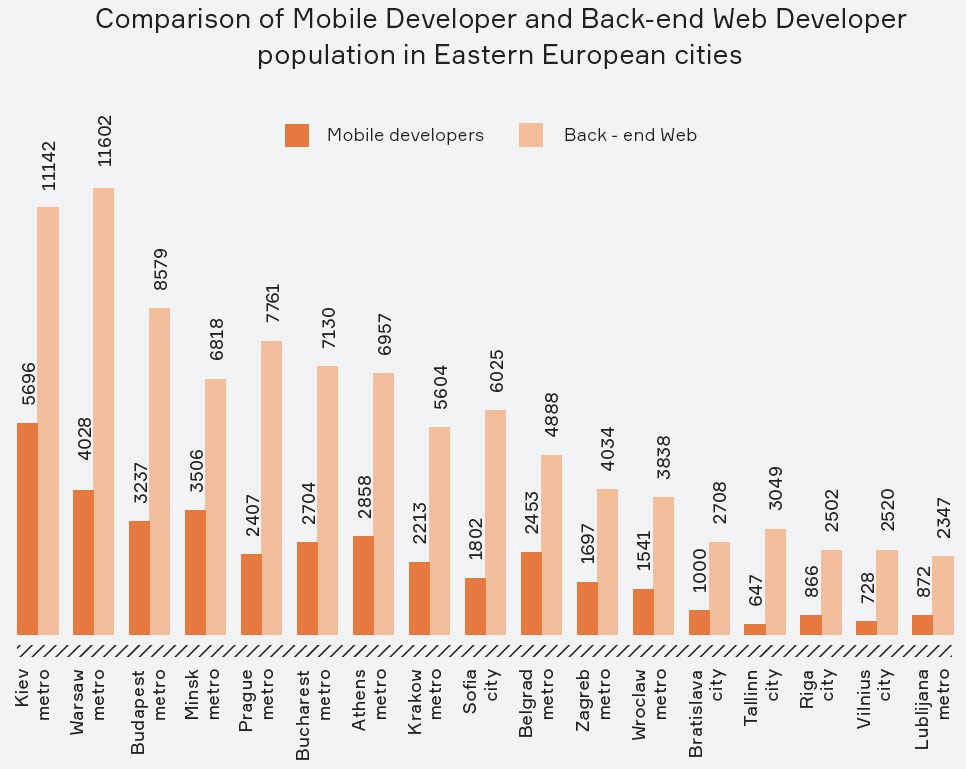
HIGHEST METRO-LEVEL POPULATION OF MOBILE DEVELOPERS IN KIEV AND WARSAW
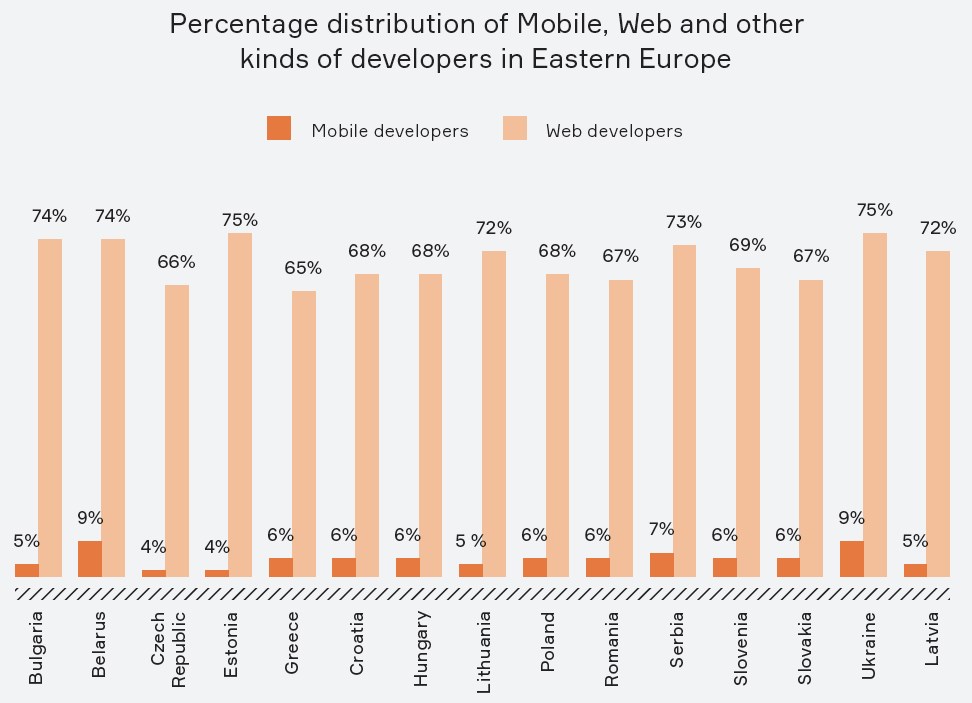
DISTRIBUTION OF MOBILE AND WEB DEVELOPERS REMAINS SIMILAR ACROSS CEE, MIRRORING GLOBAL TRENDS
Country populations
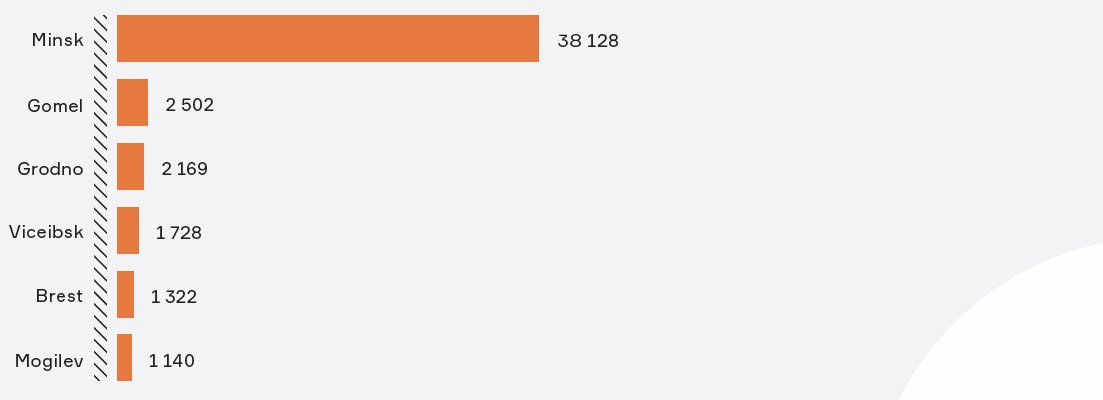
BELARUS: 45,116 DEVELOPERS
Majority of Belarusian developers are located in Minsk
Developer populations in Belarus Cities
BULGARIA: 51,024 DEVELOPERS
Majority of Belarusian developers are located in Minsk
Developer populations in Bulgaria Cities

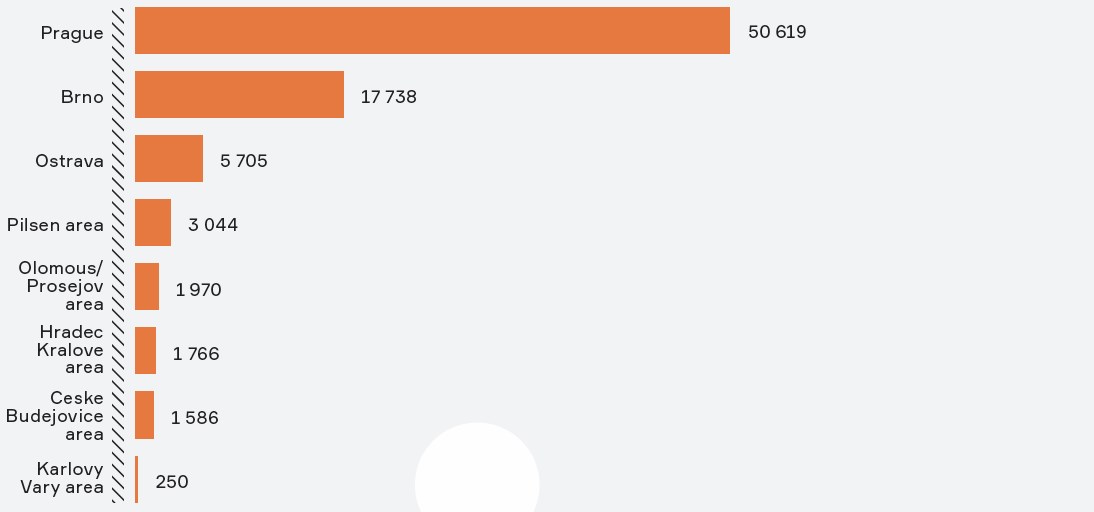
CZECH REPUBLIC: 100,498 DEVELOPERS
As seen in other CEE countries, the majority are concentrated in the capital city of Prague
Developer populations in Czech Republic Cities
ESTONIA HAS 21,047 DEVELOPERS
While this is a relatively small number, in Tallinn, this represents almost 3.5% of the total population
Developer populations in Estonia Cities

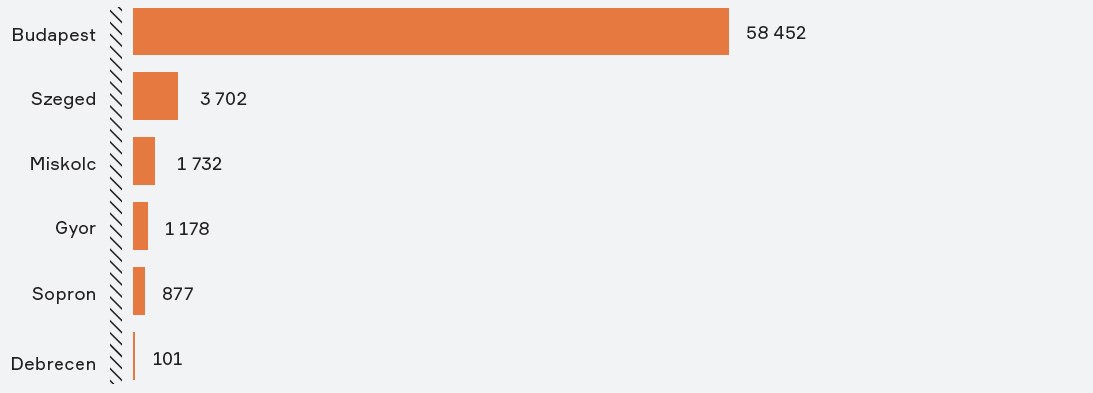
HUNGARY: 79,977 DEVELOPERS
The vast majority of Hungarian developers are concentrated in Budapest
Developer populations in Hungary Cities
LATVIA: 18,040 DEVELOPERS
As in other Eastern/Central European cities, most Latvian developers are concentrated in the capital city of Riga
Developer populations in Latvia Cities

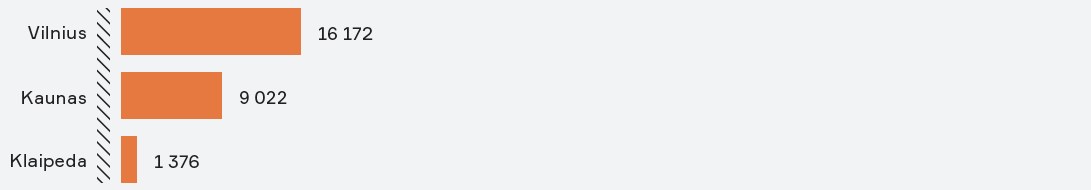
LITHUANIA: 25,264 DEVELOPERS
Lithuania has a more balanced distribution of developers across its major cities than other Central Eastern European countries
Developer populations in Lithuania Cities
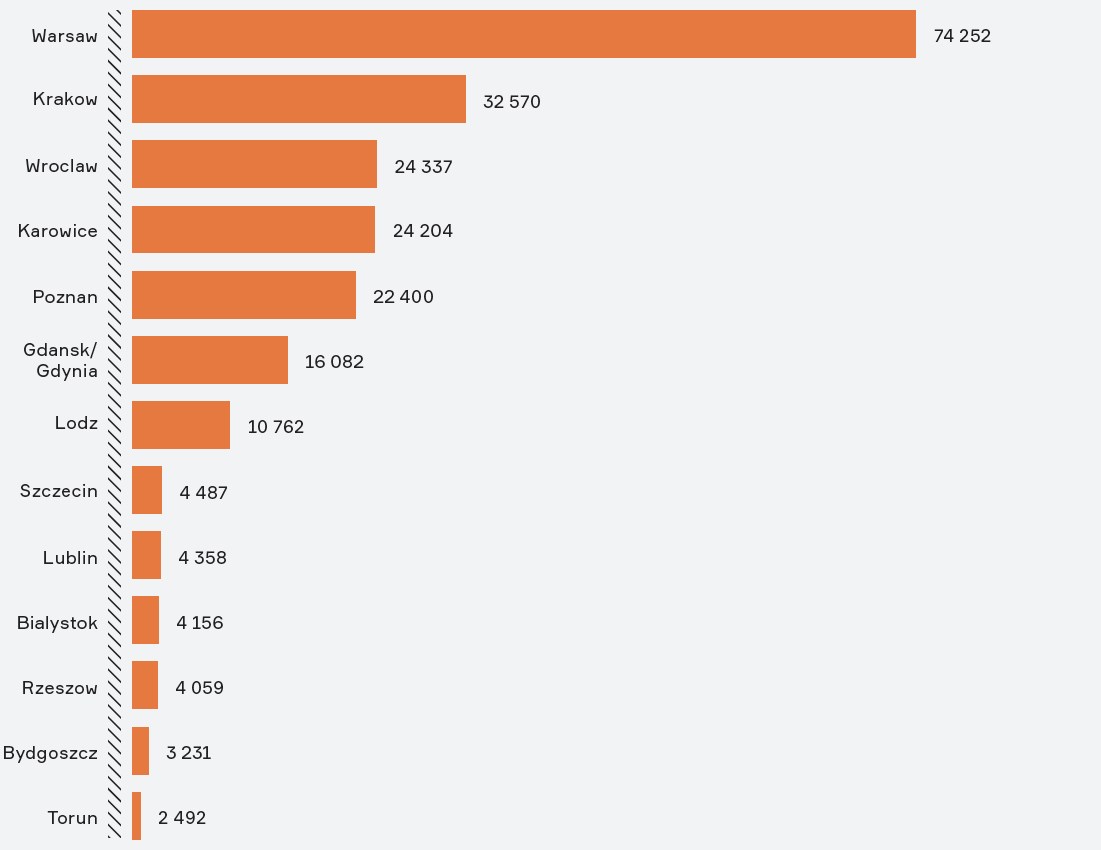
POLAND: 254,188 DEVELOPERS
76% of Polish developers are spread across Warsaw, Krakow, Wroclaw, Katowice, Poznan and Gdansk/Gdynia
Developer populations in Poland Cities
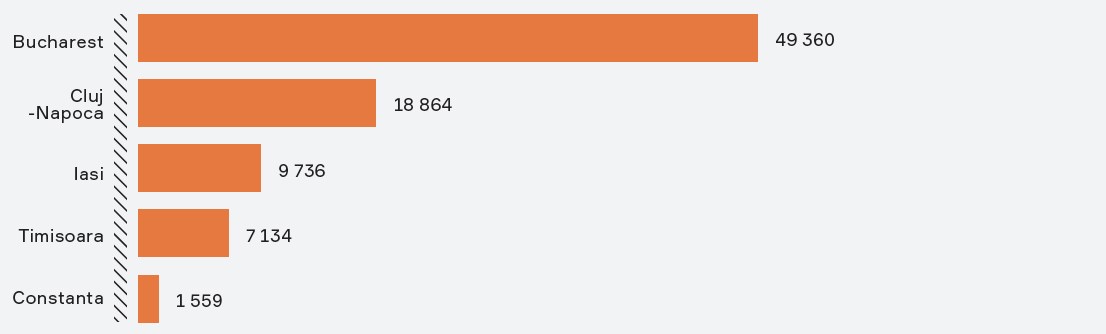
ROMANIA: 77,637 DEVELOPERS
88% of developers in Romania are based in either Bucharest or Cluj-Napoca
Developer populations in Romania Cities
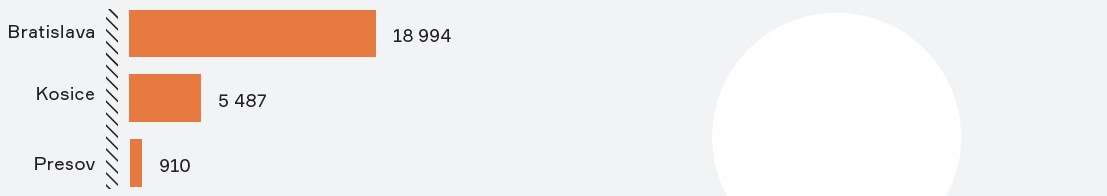
SLOVAKIA: 24,976 DEVELOPERS
Bratislava is the main location for developers in Slovakia
Developer populations in Slovakia Cities
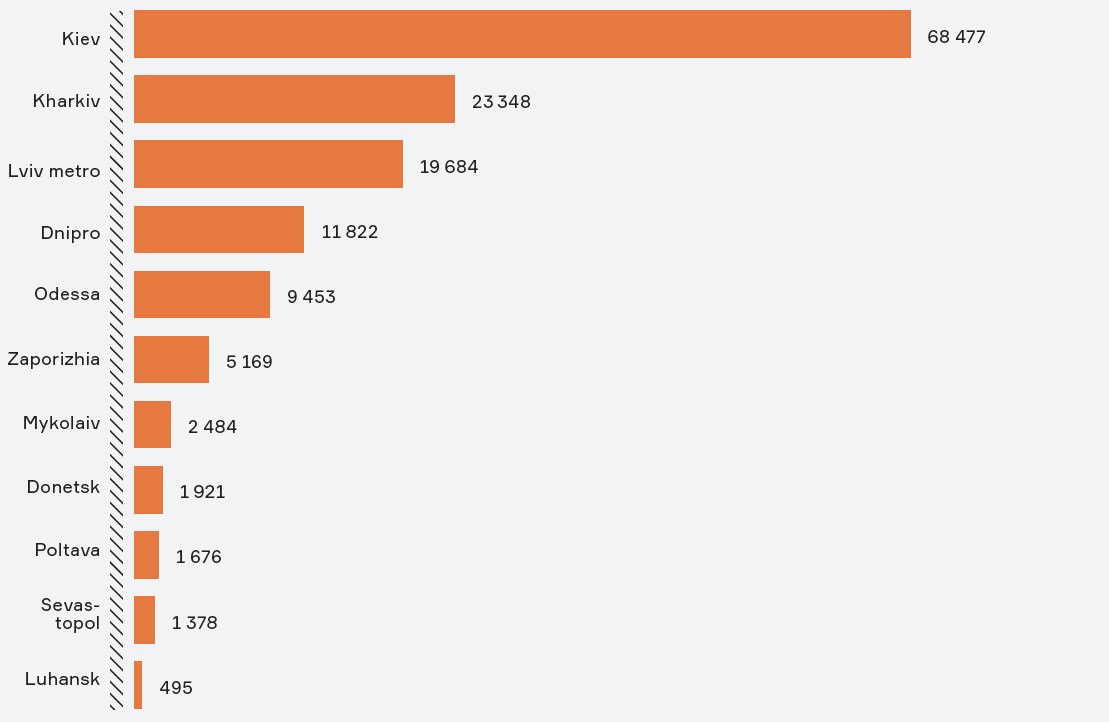
UKRAINE: 165,864 DEVELOPERS
While most Ukraine developers are located in Kiev, there are also relatively high populations of Ukrainian developers
Developer populations in Ukraine Cities
Web development in CEE
PHP IS THE MOST POPULAR WEB LANGUAGE THROUGHOUT CEE
The exception is Belarus, where Java has taken its place
Penetration of popular Web stacks in CEE
| Full Stack Web Java | Full Stack .Net | Full Stack Node.JS | Full Stack PHP | Full Stack Python | Full Stack Ruby | Full Stack Wordpress | |
|---|---|---|---|---|---|---|---|
| Bulgaria | 13% | 21% | 16% | 23% | 6% | 15% | 17% |
| Belarus | 21% | 19% | 18% | 13% | 9% | 15% | 12% |
| Czech Republic | 15% | 19% | 12% | 20% | 14 | 12% | 13% |
| Estonia | 18% | 9% | 14% | 20% | 20% | 13% | 15% |
| Greece | 16% | 14% | 11% | 20% | 14% | 12% | 17% |
| Croatia | 15% | 19% | 12% | 17% | 14% | 12% | 14% |
| Lithuania | 12% | 21% | 13% | 26% | 8% | 13% | 16% |
| Poland | 17% | 17% | 13% | 18% | 13% | 14% | 14% |
| Romania | 17% | 16% | 13% | 23% | 9% | 12% | 16% |
| Serbia | 14% | 20% | 14% | 21% | 9% | 15% | 18% |
| Slovenia | 12% | 19% | 12% | 16% | 19% | 10% | 14% |
| Slovakia | 16% | 16% | 12% | 21% | 11% | 12% | 15% |
| Ukraine | 14% | 14% | 21% | 21% | 10% | 19% | 18% |
| Latvia | 14% | 13% | 14% | 27% | 9% | 15% | 16% |
IN TERMS OF WEB STACK DEVELOPER SHARES, CEE RESEMBLES SE ASIA AND LATAM MORE CLOSELY THAN THE REST OF EUROPE
- While 16% of developers globally use Java for Web development, this ranges on a regional basis from 12% in Sub-Saharan Africa to 19% in North America.
- Though the Java stack is the #1 most commonly used globally, it isn’t the #1 language of choice in any given region – rather, it ‘wins’ globally by being the #2 choice in the largest regions (North America, Western Europe, and SE Asia).
- More developed markets (e.g. North America, Nordics) make greater use of Python for Web development, while many emerging markets (e.g. LatAm, SE Asia, Sub-Saharan Africa) are using PHP more heavily.
Percentage developer share for most common Web stacks, all regions
| Technical stack: Fullstack Web Java | Technical stack: Fullstack Web Microsoft | Technical stack: Fullstack Web NodeJS | Technical stack: Fullstack Web PHP | Technical stack: Fullstack Web Python | Technical stack: Fullstack Web RubyOnRails | Technical stack: Fullstack Web Wordpress | |
|---|---|---|---|---|---|---|---|
| Entire world | 16% | 16% | 13% | 15% | 15% | 13% | 13% |
| North America | 17% | 15% | 12% | 8% | 19% | 12% | 10% |
| LatAm Region | 13% | 17% | 13% | 21% | 10% | 15% | 14% |
| British Isles | 14% | 17% | 11% | 12% | 21% | 12% | 12% |
| Western Europe | 16% | 15% | 14% | 17% | 17% | 13% | 14% |
| Nordics | 14% | 21% | 15% | 12% | 17% | 12% | 13% |
| CEE Region | 15% | 17% | 15% | 20% | 13% | 14% | 15% |
| Russia | 13% | 17% | 16% | 18% | 18% | 15% | 13% |
| MENAT | 15% | 26% | 9% | 18% | 8% | 10% | 12% |
| Sub-Saharan Africa | 12% | 21% | 9% | 23% | 11% | 9% | 11% |
| SE Asia | 18% | 18% | 12% | 19% | 9% | 13% | 15% |
| Other APAC | 14% | 15% | 14% | 11% | 18% | 15% | 12% |
.NET LOSING DEVELOPERS TO NODE, PYTHON IN CEE
Developer market shares of common Web development stack in CEE, 2012-2016
| 2012 | 2013 | 2014 | 2015 | 2016 | |
|---|---|---|---|---|---|
| Python | 9% | 10% | 10% | 10% | 11% |
| PHP | 7% | 7% | 7% | 6% | 6% |
| Java | 7% | 7% | 7% | 7% | 7% |
| .Net | 11% | 10% | 9% | 9% | 9% |
| Node.JS | 2% | 2% | 3% | 3% | 3% |
| Ruby | 3% | 4% | 3% | 3% | 3% |
| Python | 9% | 10% | 10% | 10% | 11% |
NODE.JS GAINING DEVELOPER SHARE THROUGHOUT CEE
Node.JS gaining developer share throughout CEE, 2012-2016
| 2012 | 2013 | 2014 | 2015 | 2016 | SLOPE | |
|---|---|---|---|---|---|---|
| Ukraine | 14% | 16% | 18% | 19% | 21% | 2% |
| Belarus | 12% | 14% | 16% | 17% | 18% | 1% |
| Bulgaria | 12% | 13% | 14% | 15% | 16% | 1% |
| Latvia | 11% | 12% | 13% | 14% | 14% | 1% |
| Estonia | 11% | 12% | 13% | 14% | 14% | 1% |
| Serbia | 10% | 12% | 12% | 13% | 14% | 1% |
| Poland | 9% | 11% | 11% | 12% | 13% | 1% |
| Lithuania | 9% | 11% | 11% | 12% | 13% | 1% |
| Slovakia | 9% | 10% | 11% | 12% | 12% | 1% |
| Croatia | 9% | 10% | 11% | 11% | 12% | 1% |
| Hungary | 9% | 10% | 11% | 11% | 12% | 1% |
| Slovenia | 9% | 10% | 10% | 11% | 12% | 1% |
| Czech Republic | 8% | 10% | 10% | 11% | 12% | 1% |
| Greece | 8% | 9% | 10% | 11% | 11% | 1% |
Fastest gains and highest penetrations in Ukraine, Belarus
PYTHON USAGE FOR WEB DEVELOPMENT GROWING THROUGHOUT CEE
Percentage of developers who use Python for Web development Central & Eastern Europe, 2012-2016
| 2012 | 2013 | 2014 | 2015 | 2016 | SLOPE | |
|---|---|---|---|---|---|---|
| Estonia | 18% | 18% | 18% | 19% | 20% | 1% |
| Slovakia | 15% | 15% | 16% | 18% | 19% | 1% |
| Croatia | 11% | 12% | 12% | 13% | 14% | 1% |
| Greece | 10% | 11% | 12% | 13% | 14% | 1% |
| Czech Republic | 11% | 11% | 12% | 13% | 14% | 1% |
| Poland | 11% | 11% | 12% | 13% | 14% | 0% |
| Slovenia | 9% | 9% | 9% | 10% | 10% | 1% |
| Hungary | 8% | 9% | 9% | 10% | 11% | 1% |
| Ukraine | 9% | 9% | 9% | 10% | 10% | 0% |
| Belarus | 7% | 8% | 8% | 9% | 9% | 1% |
| Latvia | 7% | 8% | 8% | 8% | 9% | 0% |
| Serbia | 7% | 7% | 8% | 8% | 9% | 0% |
| Lithuania | 7% | 7% | 7% | 8% | 9% | 0% |
| Bulgaria | 5% | 6% | 6% | 6% | 6% | 0% |
Strongest adoption growth in Estonia, Slovakia

Co-founder of infoShare, the biggest tech conference in CEE region. Co-founder of infoShare Academy. Previously the Head of Web Development Department at Wirtualna Polska.
Although we might say that PHP is rather not sexy, it still holds the position of the most popular web language, not only in Poland, but also across the CEE region. It is worth noticing that Python is favoured in North America, the British Isles, the Nordics, Western Europe and even Russia, but not in Eastern Europe. This will probably change soon due to the dynamic increase of Python usage in the region.
JavaScript is the most approved programming language of the world
JavaScript is the most approved programming language of the world, used by nearly 62% of developers. A large variety of frameworks and libraries, such as ReactJS, AngularJS, Vue.js or Node.js make this language more and more in demand every year. This is what’s happening in Poland – PHP remains at the same level, but Node.js is growing dynamically.
Tags:
See also:

LATEST NEWS
Od czego zależy sukces wdrożeń AI? - polskie i amerykańskie trendy w branży tech 24.10.2025
Five highlights from EU Space Days 2025 13.06.2025
🤝 Networking i zabawa na Infoshare 2025 30.04.2025
⭐ Spotkaj liderów innowacji | Keynote Speakers 23.04.2025
🎸 Zagraj na Great Networking Party | Call for Bands 16.04.2025
🏆 Gdańsk Startup Award – Twoja Szansa na Sukces! 09.04.2025